New Personal Records Analysis: Is Your Training Working?
Performance Analytics joins your indoor and outdoor ride data into a set of tools designed to make you faster while leaving out the bloat.
This post is dedicated to Personal Records (PRs).
Personal Records = Personal Wins
Power-based Personal Records are my favorite kind of feedback. It doesn’t matter who showed up to the race, if it was super windy or if my technical skills were off that day. I can still get a personal “win” by laying down the power.
The problem is that current Personal Record charts are broken in my opinion. They always grouped things into years or the last 6-weeks; these were hardly meaningful in my training.
Introducing TrainerRoad Seasons and SeasonMatch
Fitness is cyclical, meaning you’re usually (if training correctly) stronger at the end of the season compared to the beginning.
There’s often a period of rest after a season where a slight decrease in fitness happens; then you start with a higher fitness point compared to last season.
There was no way to easily compare fitness at different points in a season until now.
TrainerRoad Personal Record Chart
We re-imaged what a Personal Record chart should be.
The first thing we thought of is that we wanted to compare one season to another. These often didn’t line up precisely with years and often overlapped each other. For instance, Road season might start in March and go until Sept, while ‘Cross season begins in August and ends in mid-January.
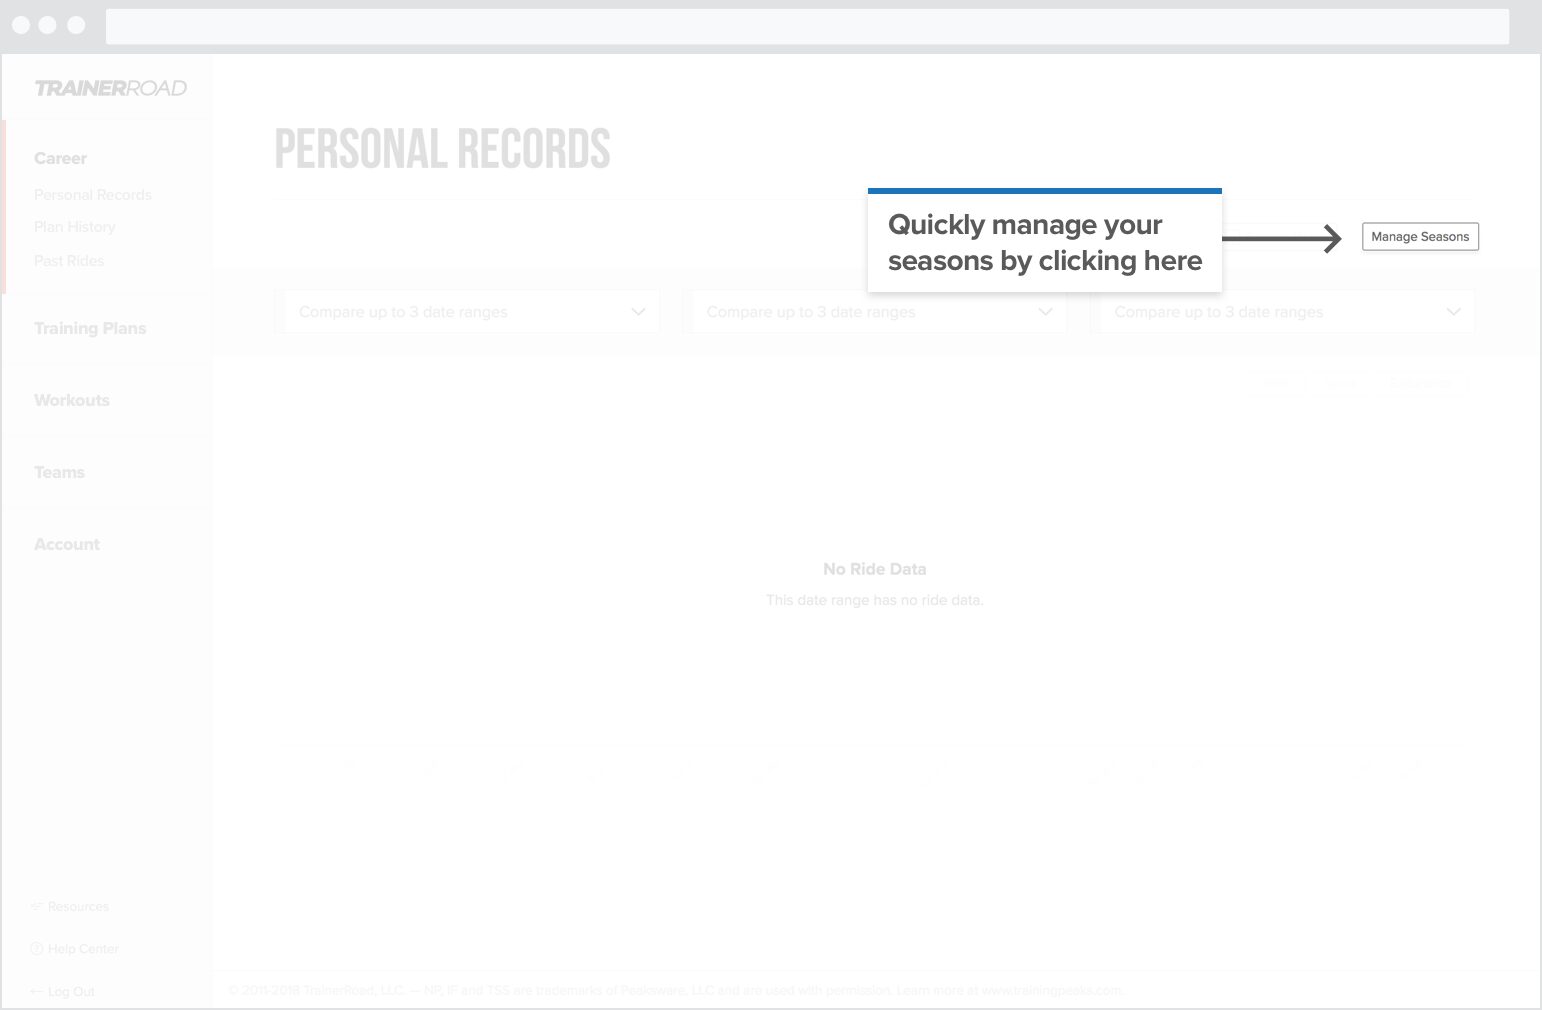
You can quickly manage your seasons by clicking on the Manage Season button.
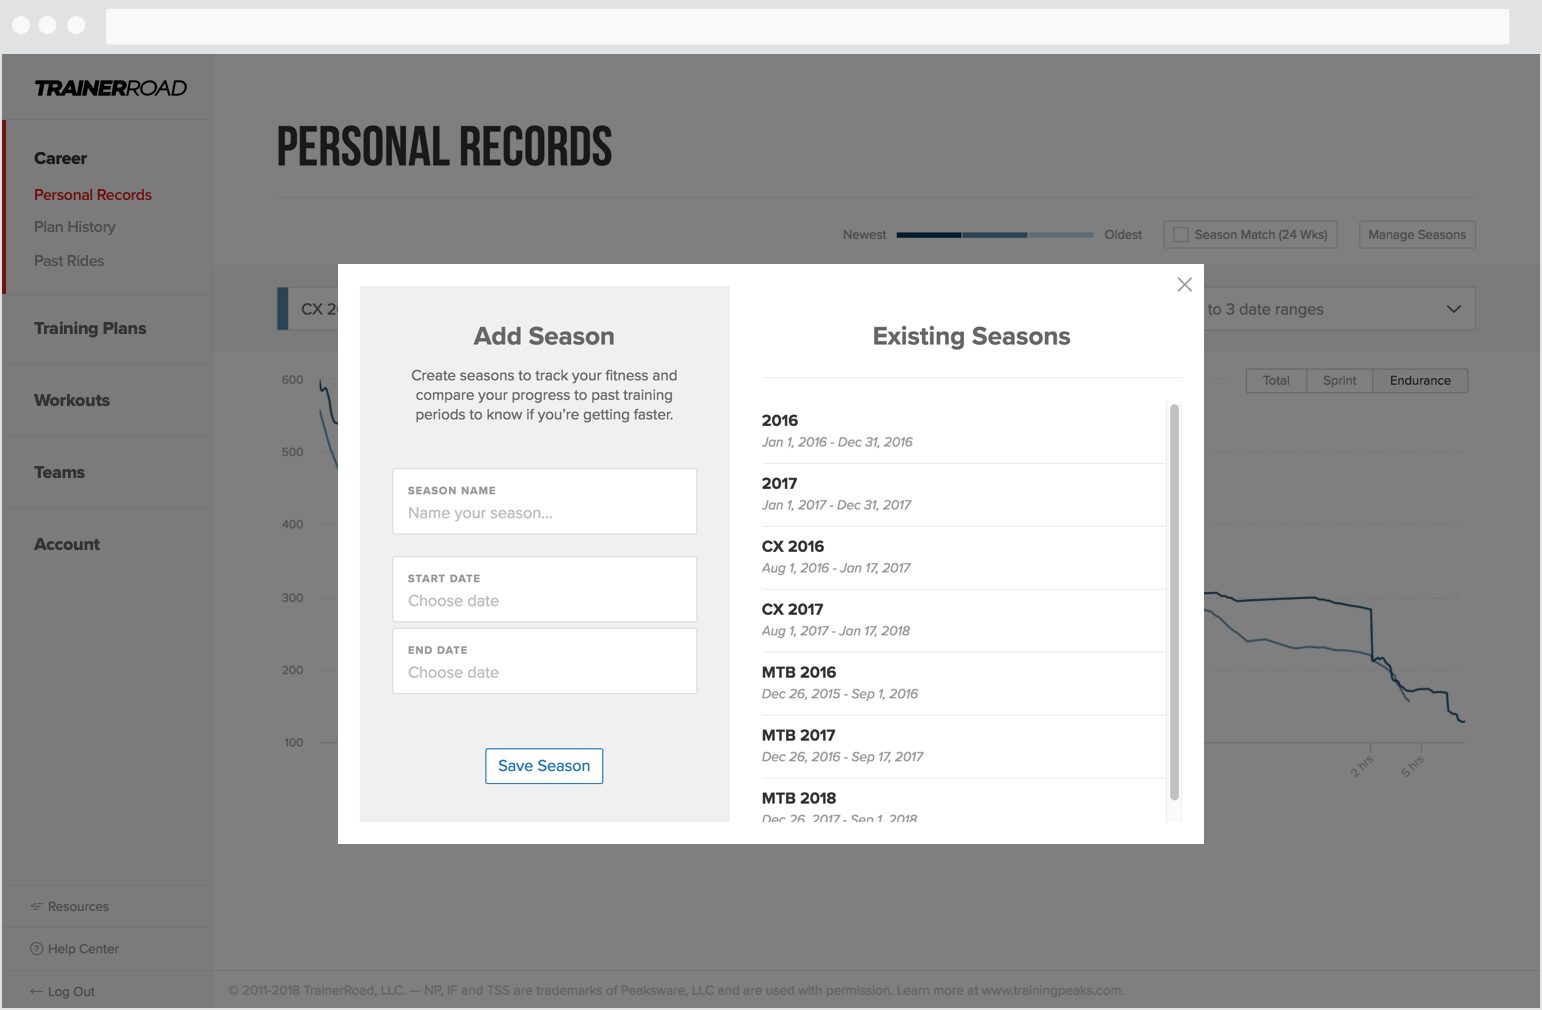
You can see here that I’ve created a few seasons. I don’t have to line up any days or start on the same day each year.
I can then compare up to three seasons at a time. Here I’m comparing my MTB 2018 season vs. my MTB 2017 Season.
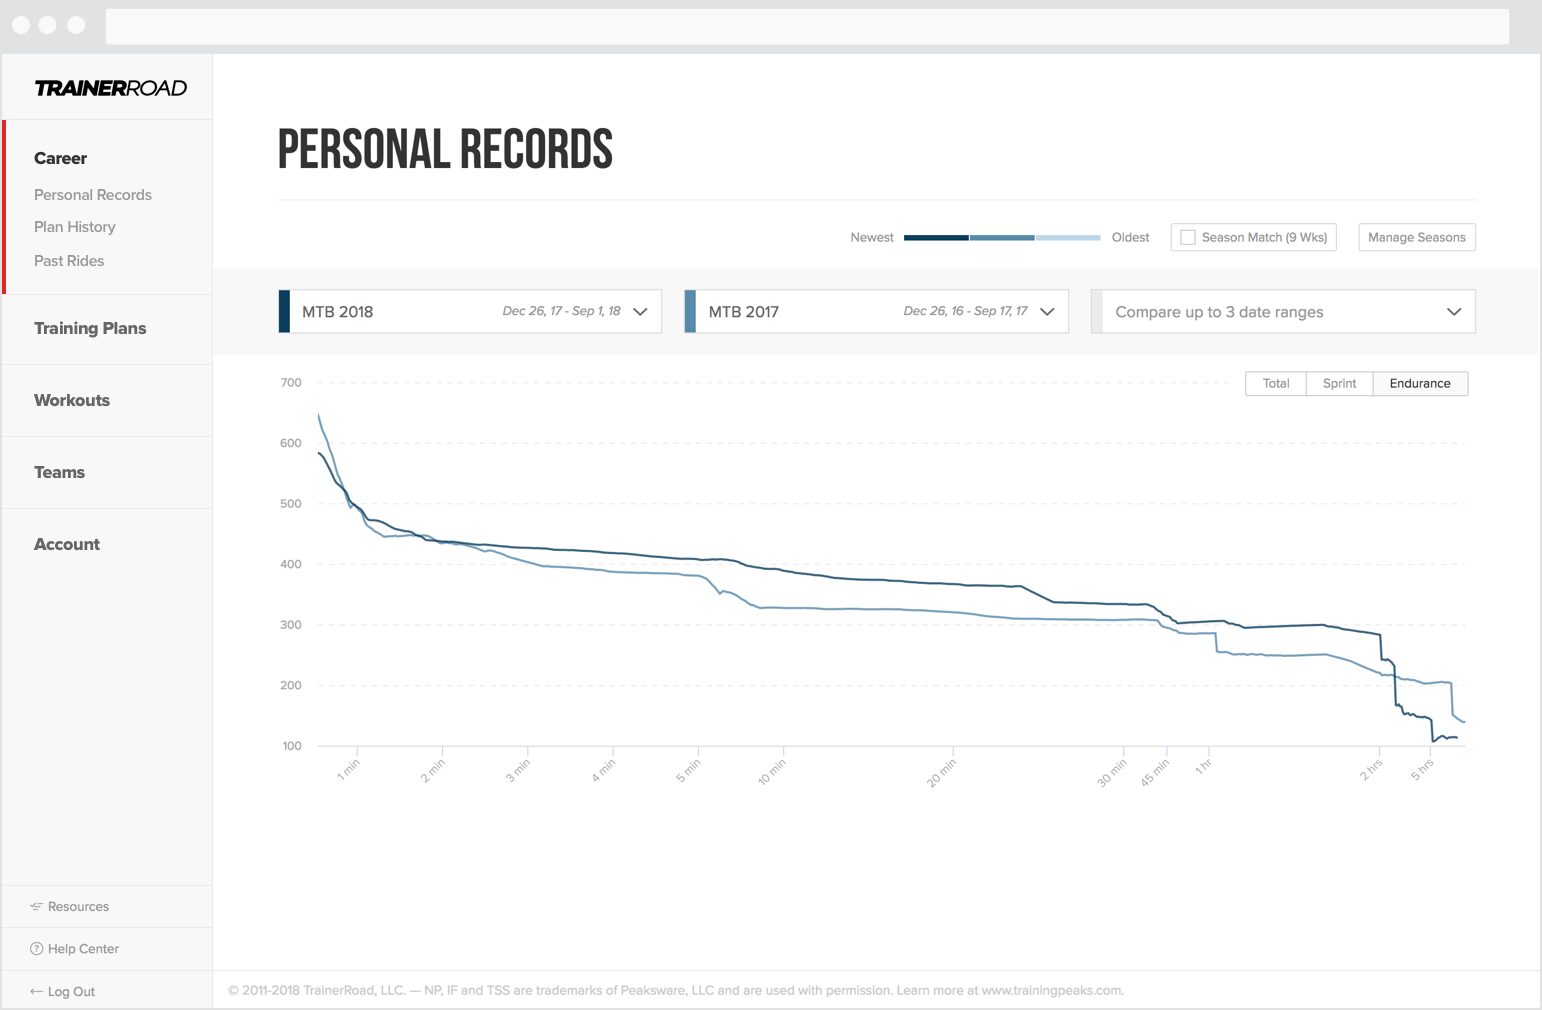
There are a few updates here compared to our previous chart.
1. We’re now doing PRs for every second up to 5 minutes; then we switch to slightly larger buckets.
We did this because we’d often work hard on a climb and have it take a non-standard PR bucket…like 4 minutes and 22 seconds. But boy do we want that PR if that’s the most power we’ve put out for 4 minutes and 22 seconds!
2. Our x-axis stretches all the way out to 17 hours (if you’re crazy enough to have rides that long). This will be dynamic based on the data you have.
We’ve made it so the graph will still be readable even if you have a 17-hour ride on it.
3. We’ve made three views of your PR chart:

One problem with existing personal record charts is that they show a very large scale on the y-axis. This can go well over 1000 watts for some riders which leave very little space to visualize 10 to 20-watt improvements at longer durations.
We’ve fixed this problem by doing the obvious: have a view to track your sprint power and another view to track your endurance power.
We’ll come back to the new PR chart views later.
Let’s start to compare seasons and see what we can learn.
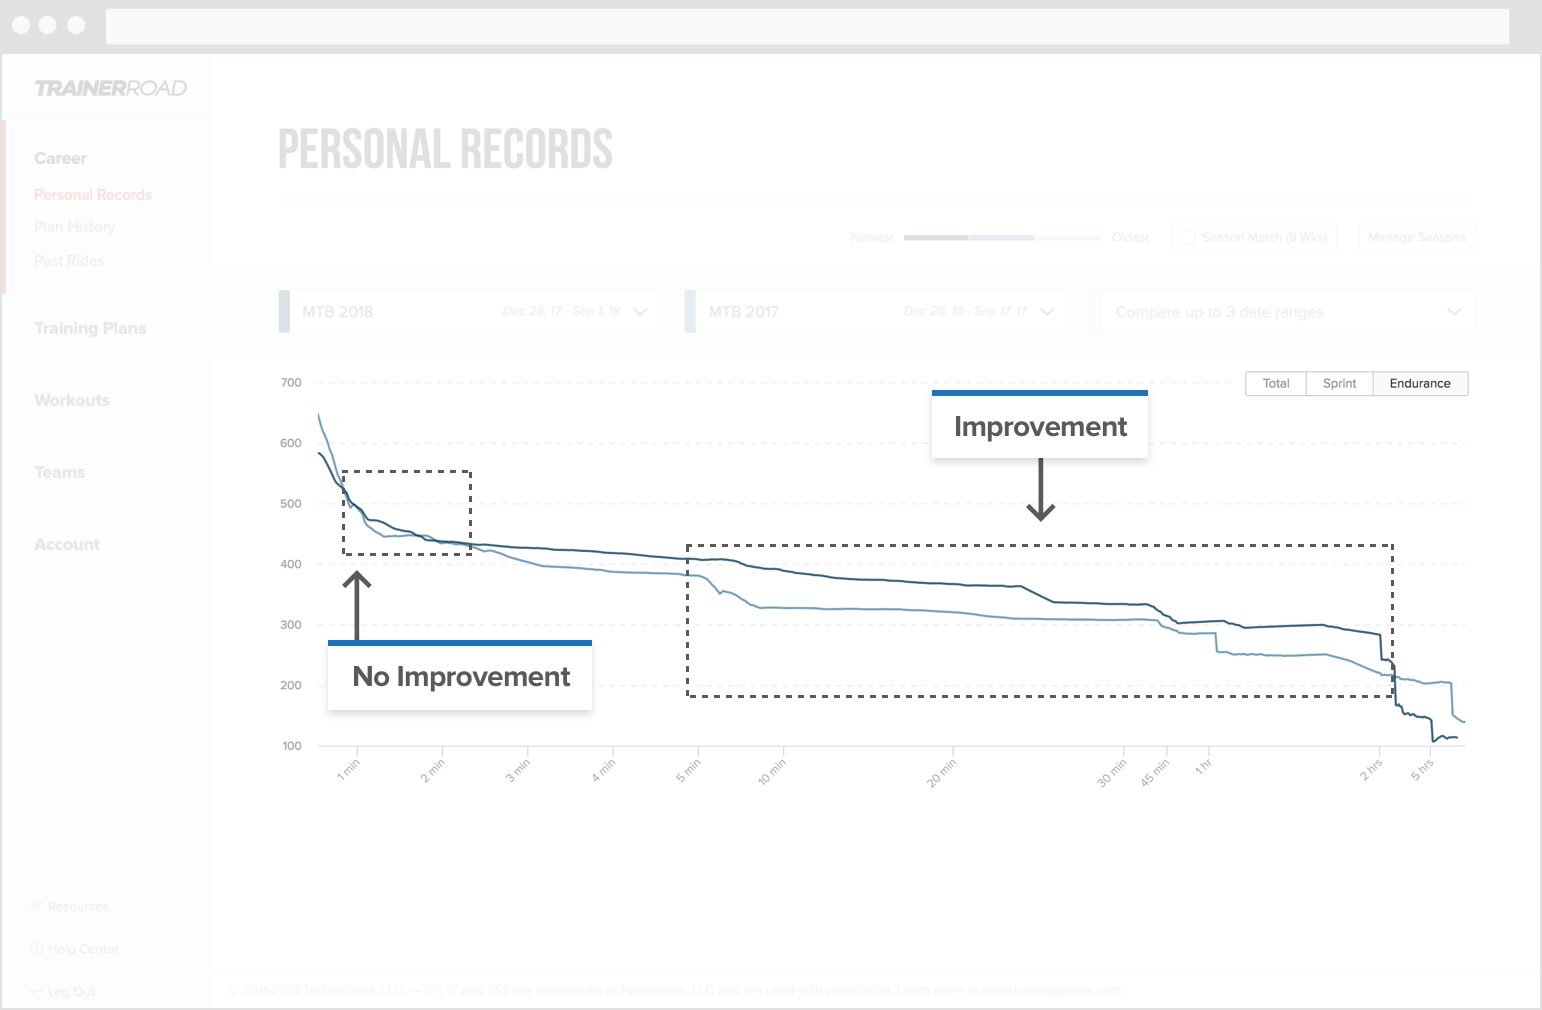
The first thing I notice when I compare my PRs between MTB 2018 and MTB 2017 is that I’ve significantly improved my power from about 2 minutes to 2 hours.
I’ve also not improved at all between 30 seconds to 1 minute. This is to be expected since I haven’t been training my short power at all.
Let’s look at my 8-minute PRs next.
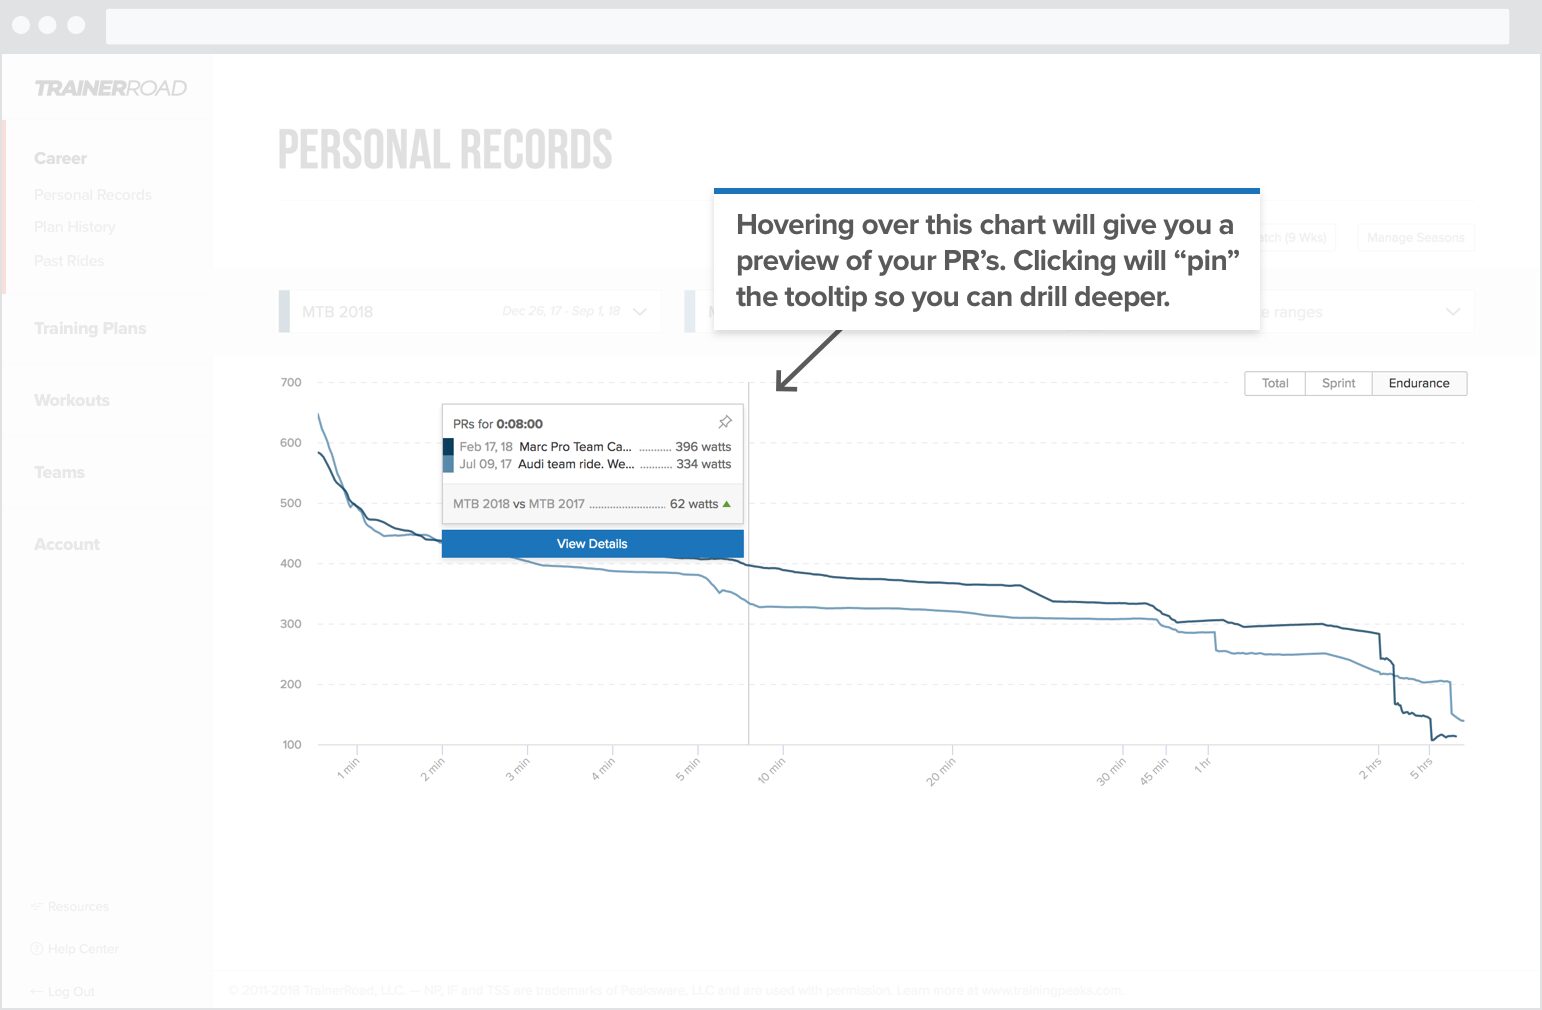
You can see here that my power is up 62 watts for 8 minutes, that’s great! You can also see the name of the ride and what day they happened on.
If you click on the ride name, you’ll be sent to our new ride analysis page that will auto highlight where that PR happened (more on that in a future post).
But it’s February, and most of those MTB 2017 PRs came in August when I was at peak fitness.
What I want to do is compare my fitness in my MTB 2018 fitness to the same point in time in my MTB 2017 Season.
This is where SeasonMatch comes in. By clicking that, the PR Chart will only show data for the first nine weeks of MTB 2018 (my current season) and just the first nine weeks of MTB 2017.
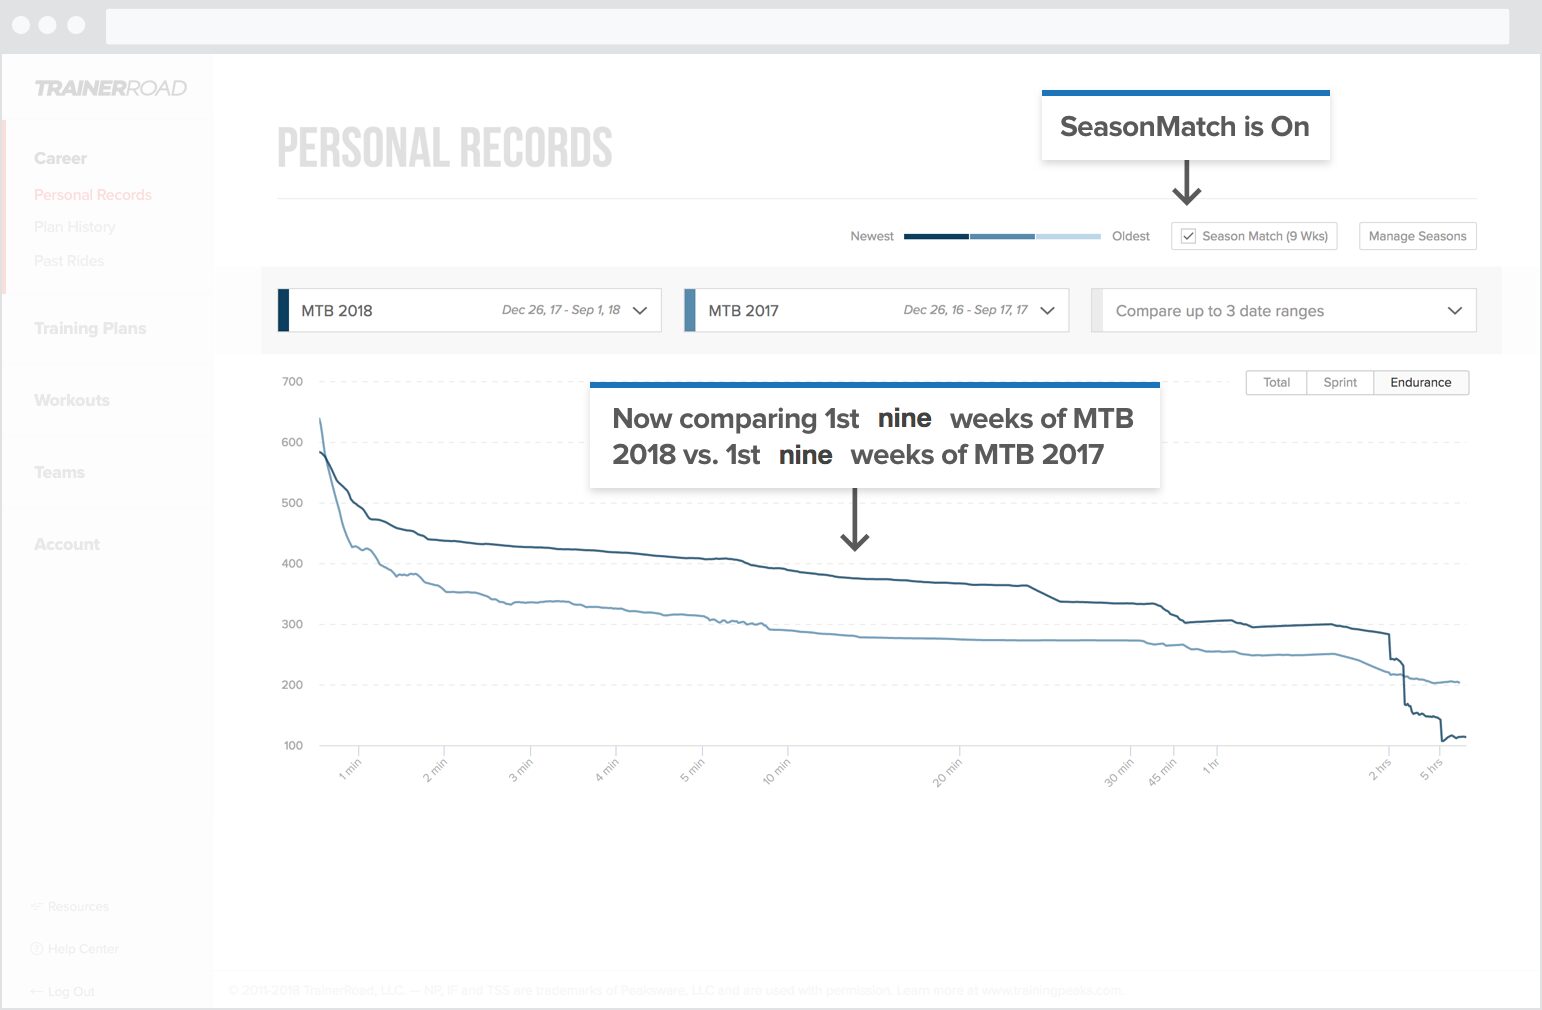
You can see that I’m much stronger than I was at this point in my MTB 2017 season. This is excellent feedback and shows that training pays off.
Let’s drill into that same 8-minute PR again.
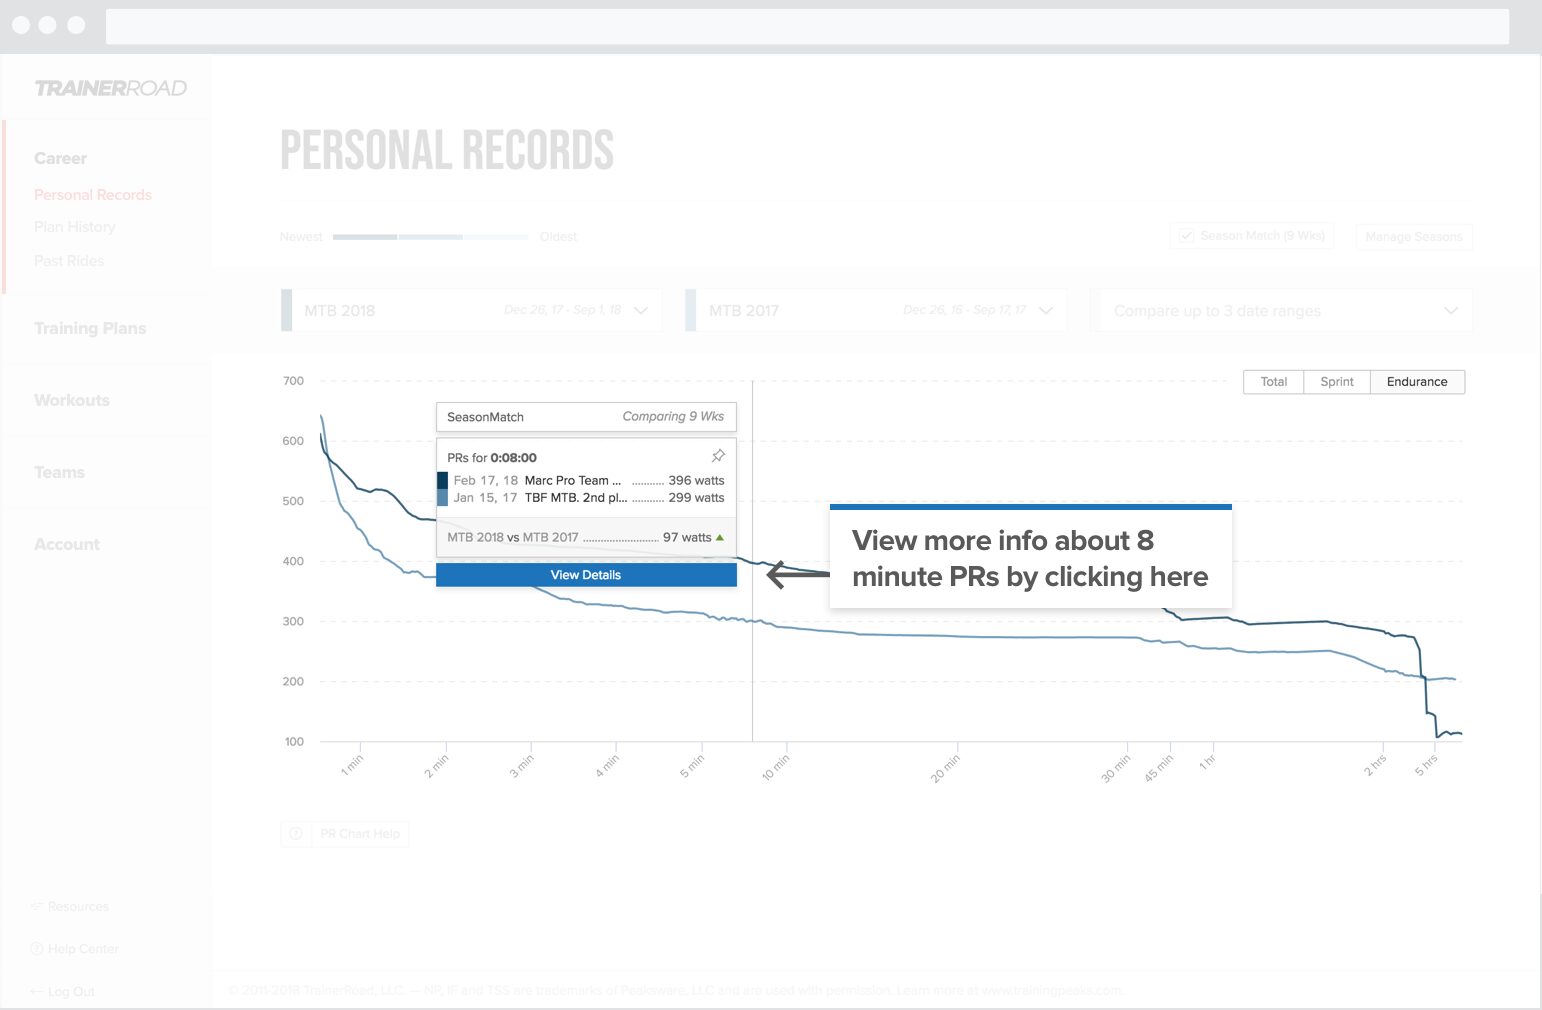
It now shows I’m up 97 watts, which is even more motivating to keep my training consistent and smart (aka TR style).
We can go deeper! Next, let’s click View Details.
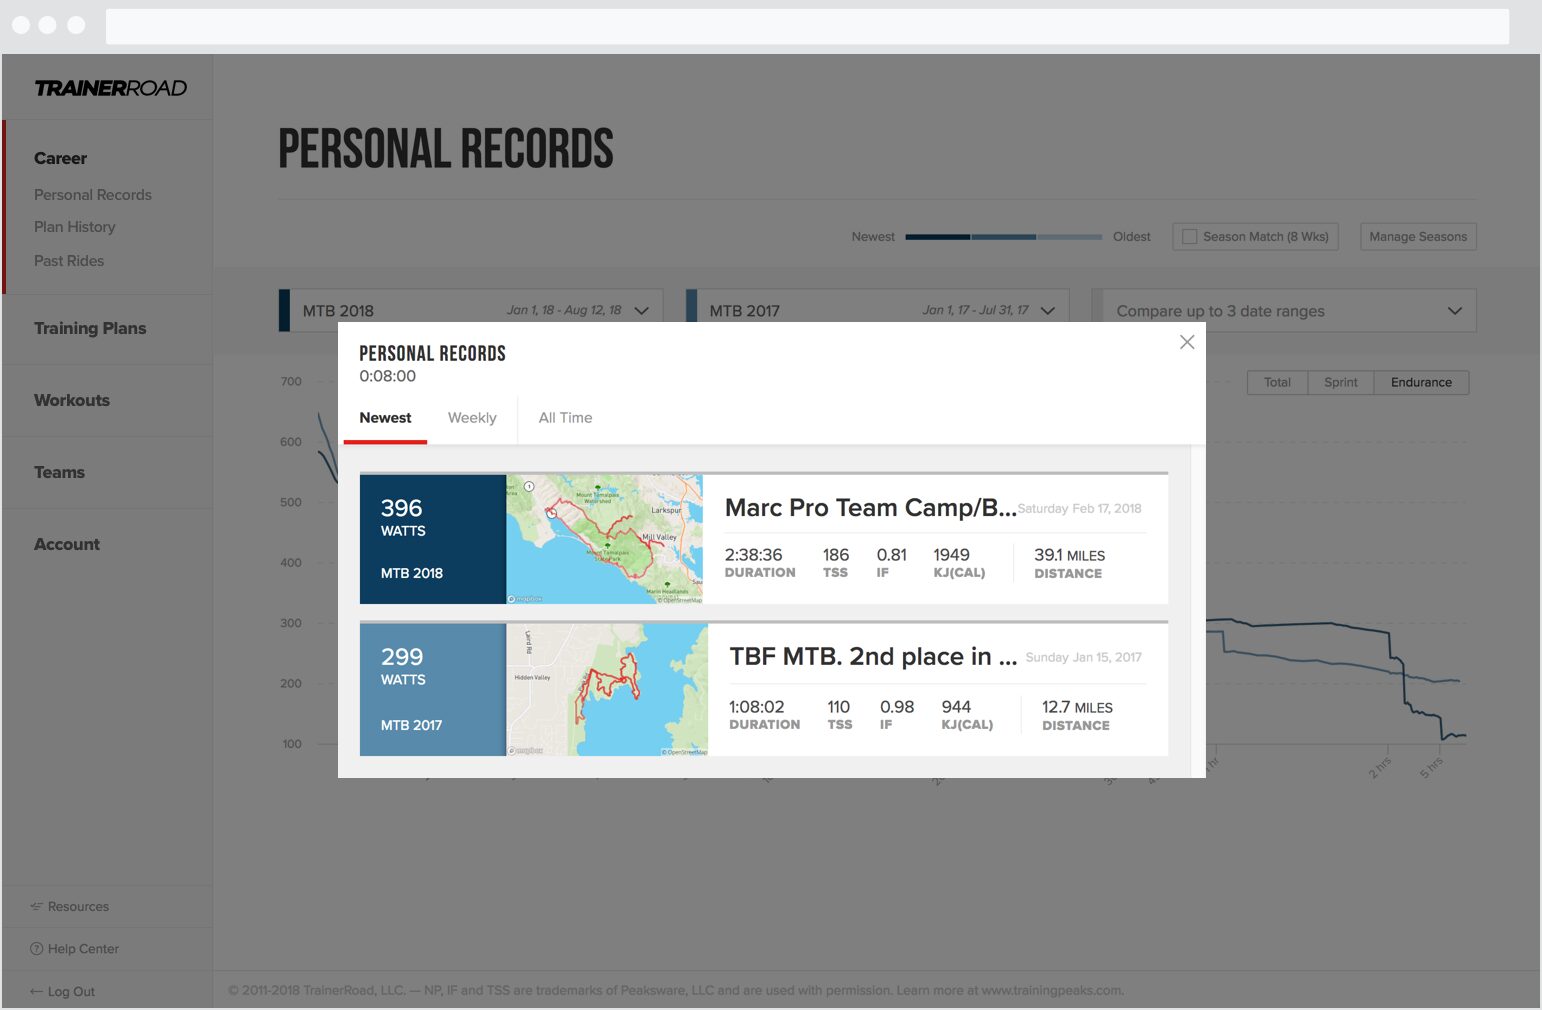
View Details comes up with a quick view to give you more context around that ride without leaving the page.
I can also click the “Weekly” tab.
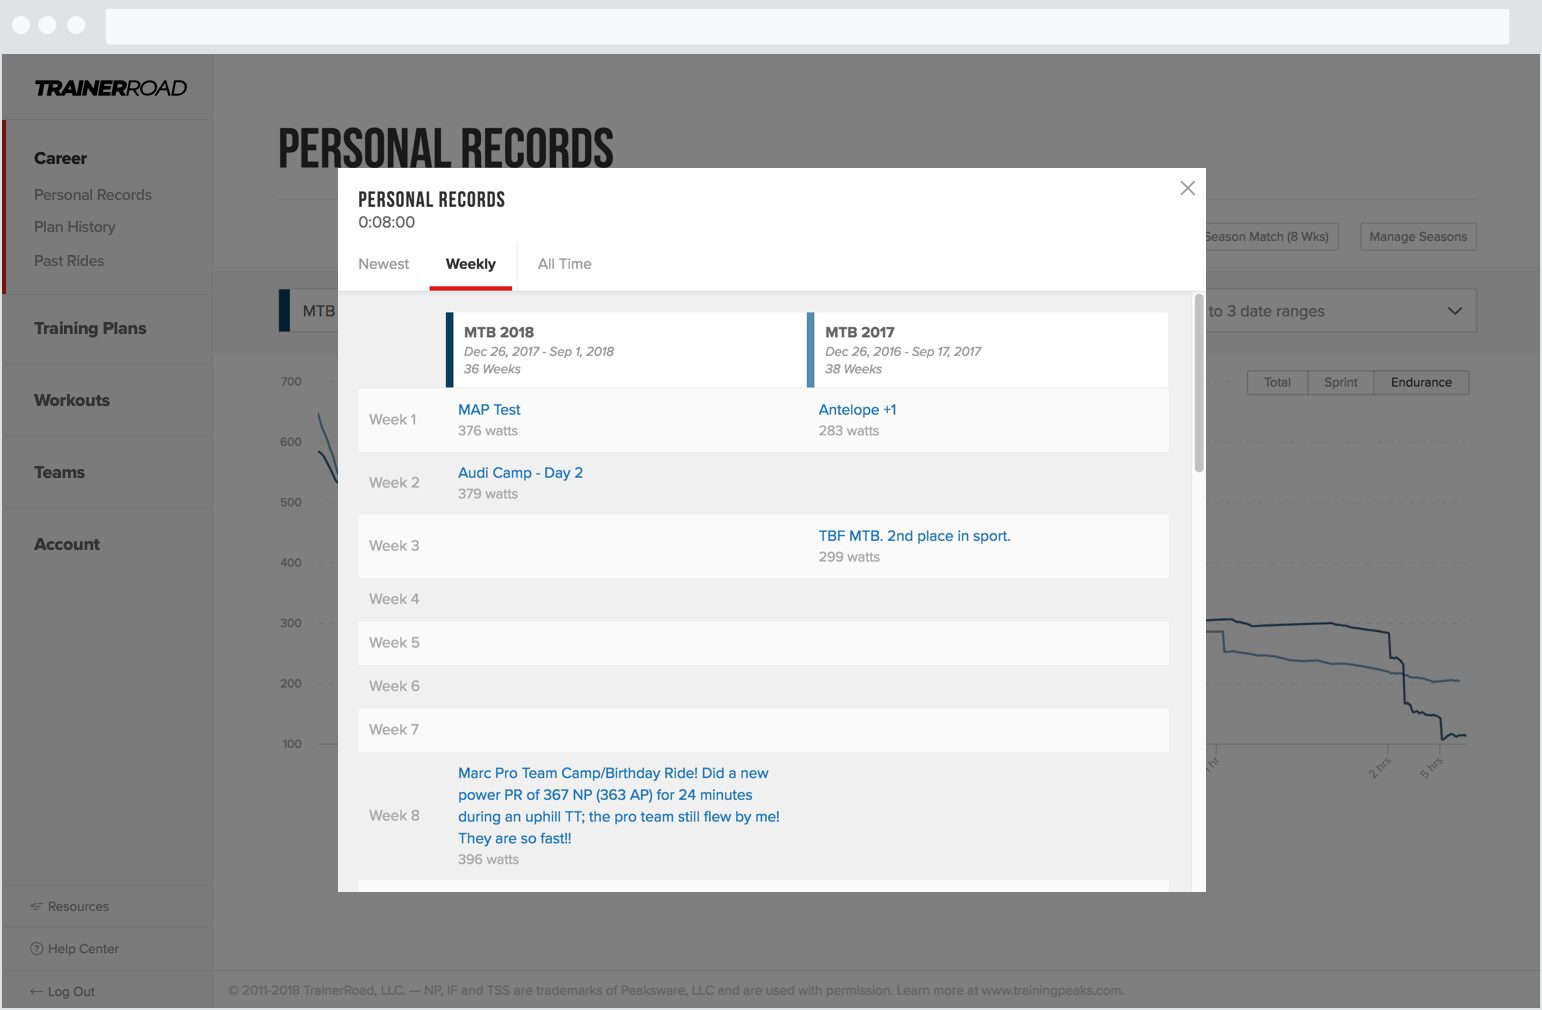
The Weekly tab is for comparing the progression of a power PR, either stand-alone or between seasons.
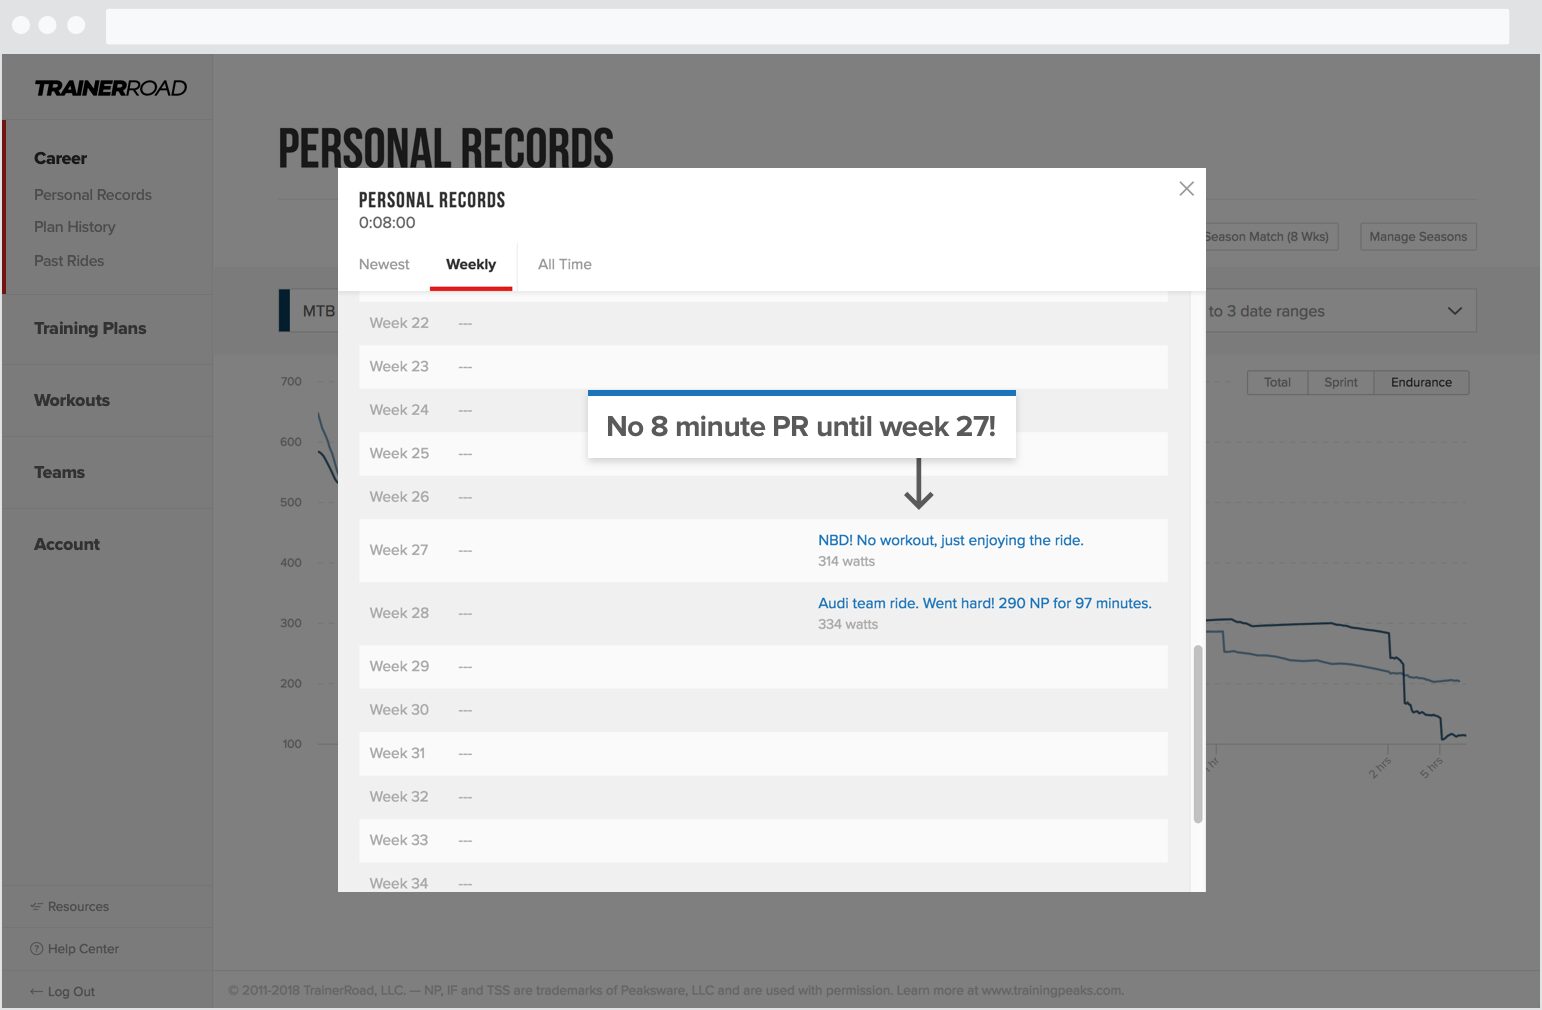
In this table, you’ll get a new entry for every time you get a new power PR for that duration. In my MTB 2017 season, it took me 27 weeks to get another 8-minute power PR! That seems like a long time, and it is! Podcast listeners will remember I broke my collarbone at the end of January 2017 and it took almost the whole season to get my fitness back.
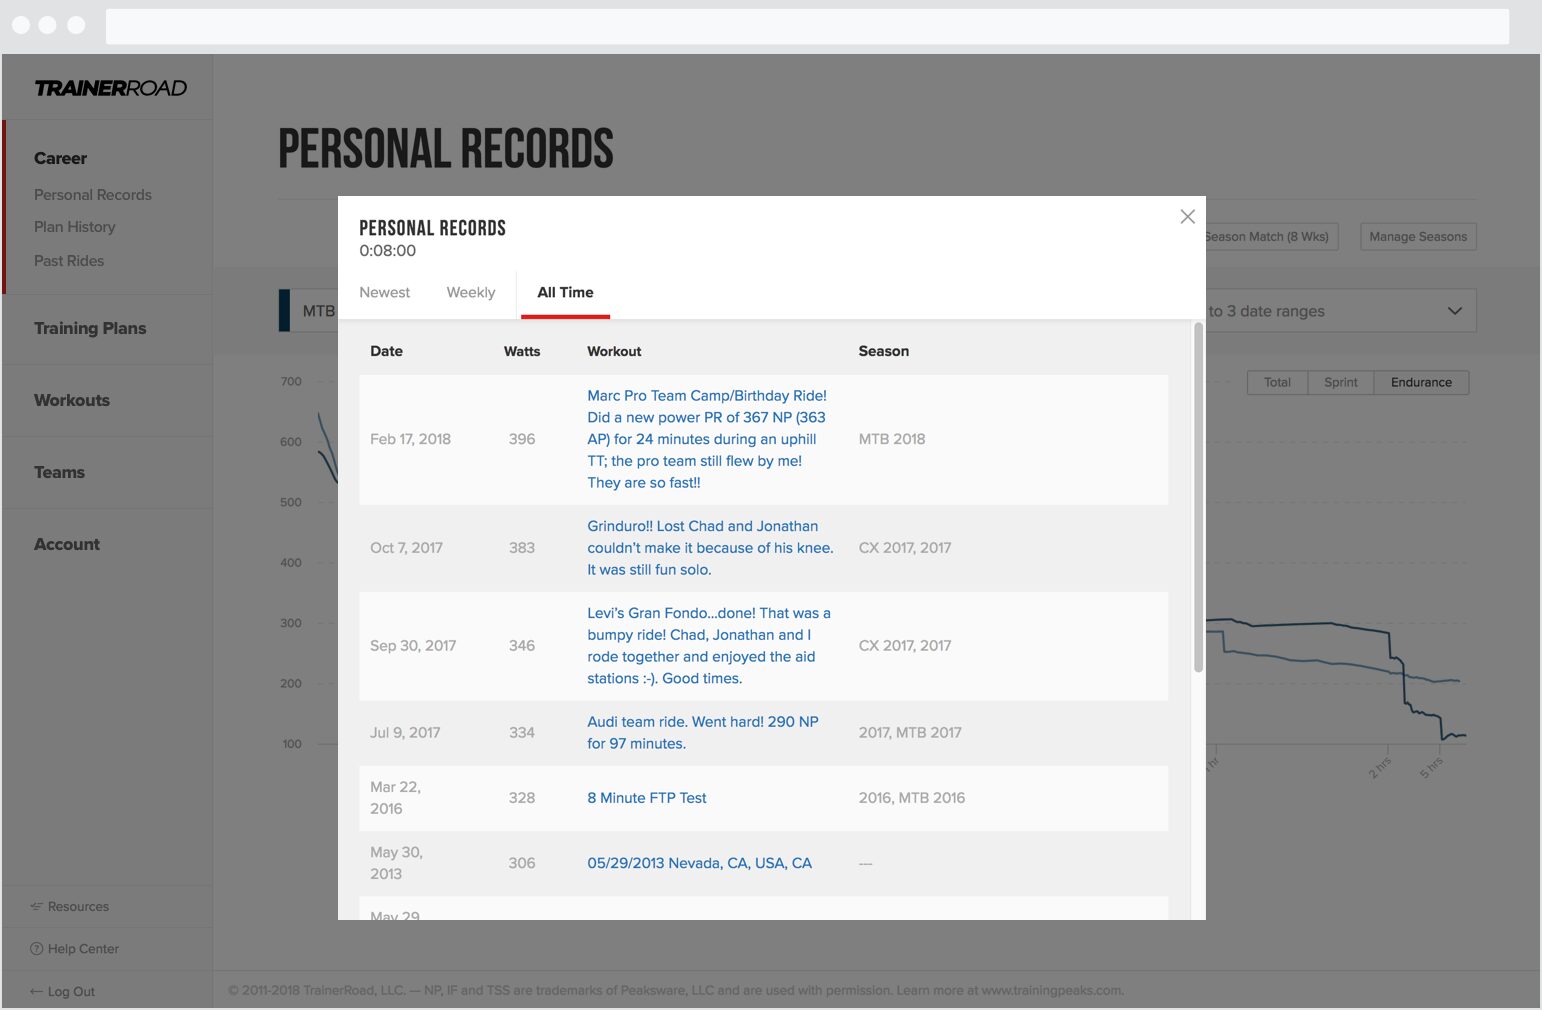
The All Time tab lists the rides where your power PR at that duration improved. You can also see what seasons your PRs happened in.
Let’s now turn SeasonMatch off and look at my Sprint PR view.
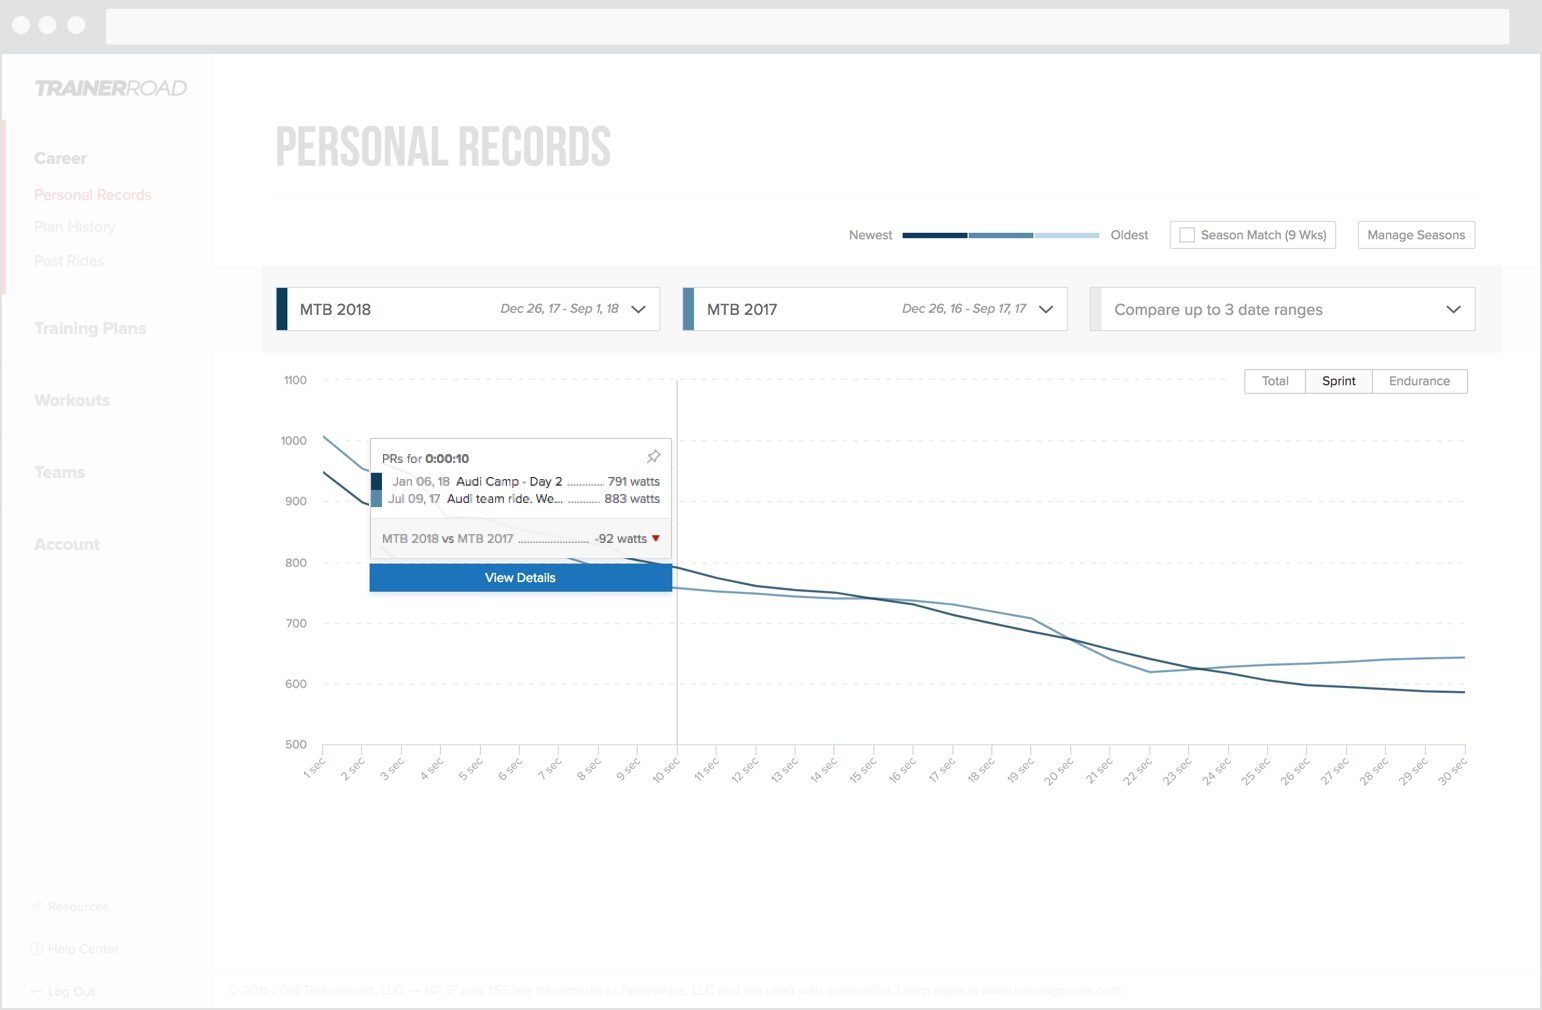
I’ve selected my 10-second sprint. I’m 92 watts lower this season compared to last season.
Now let’s turn SeasonMatch back on to see how I was doing in February during my MTB 2017 Season.
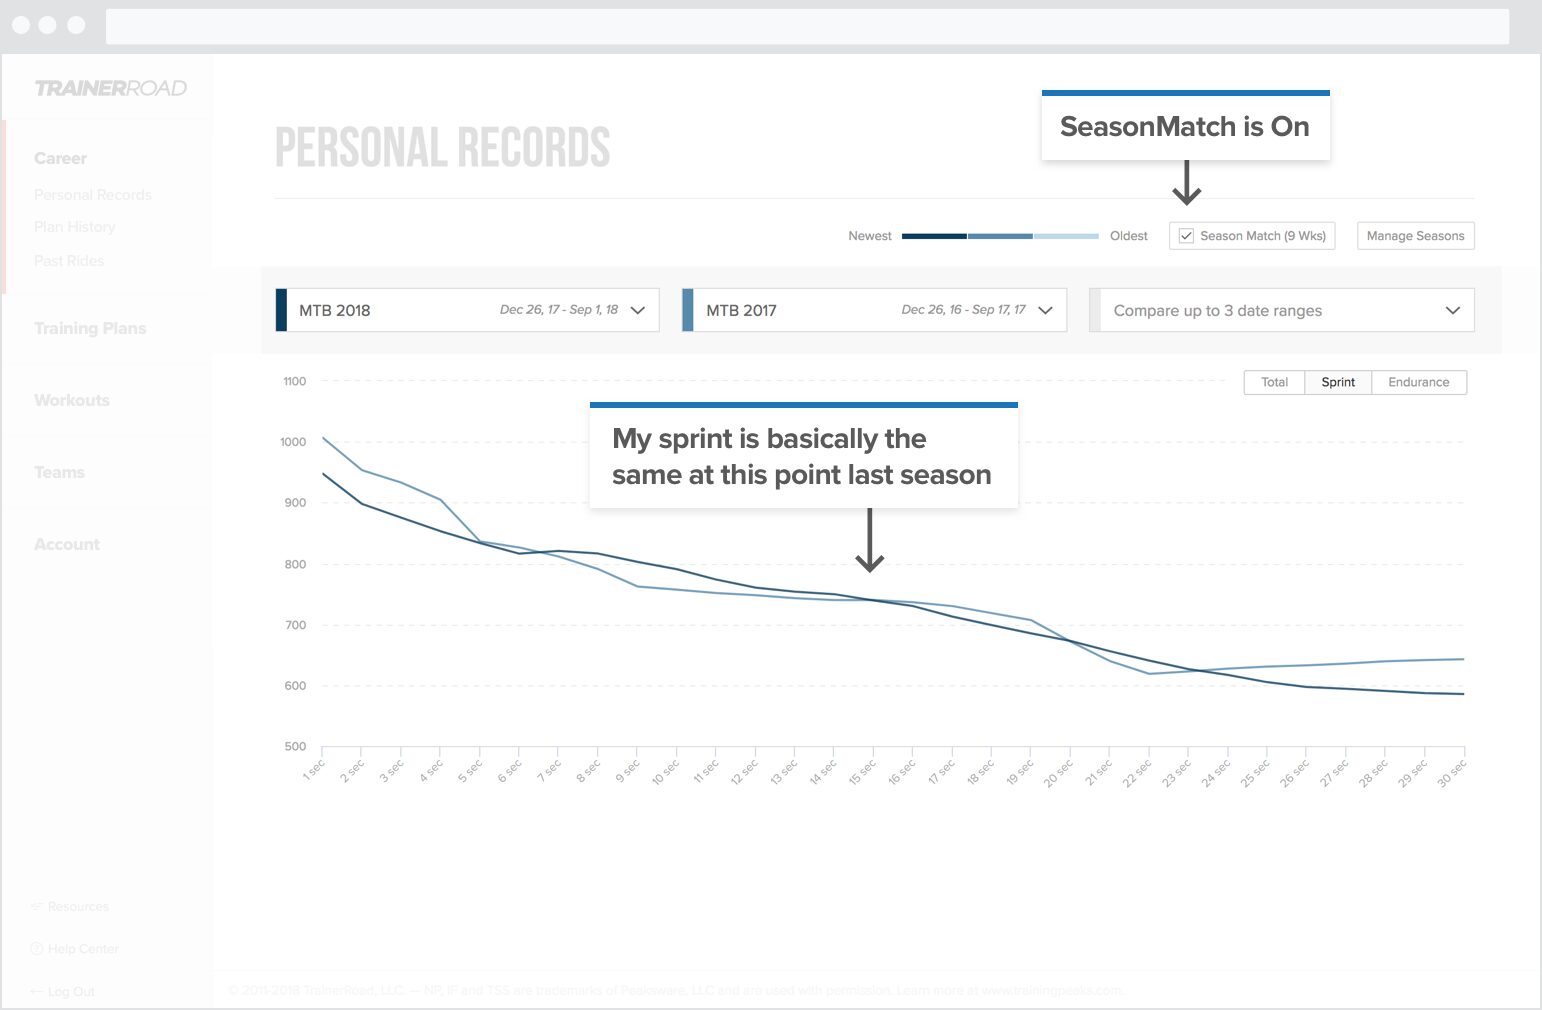
My sprints were mainly the same at this point last season. Again, that’s to be expected since I haven’t trained my sprint at all. I do know that I haven’t lost anything and if I wanted to train my sprint, I’d have a good starting point.
Earning Personal Records per Season
Getting PR feedback is really motivating. Every time I produce more power I get a little win that I can take back and know that my training is working.
We’re now calculating PRs per season. That means that if your ride produced the most power at 5 minutes for an active season you’re in you’ll get a new PR! This is shown on the updated ride page and our fancy new career page.
You’ll also be able to compare a ride against your season PRs easily. We’ll cover that when we hit the new Ride page.
That’s our new PR feature in a nutshell.
Next time we’ll cover the new Ride Analysis Page!
Get Started with Performance Analytics
Learn More About Performance Analytics
For more information on each feature of Performance Analytics, learn more on our YouTube Playlist and Help Center:
